
Water Report July 21, 2021
Inverness Public Utility District Water System
Water Usage (Production) vs. Streamflows, July 21, 2020 and 2021
This chart compares the differences between last year’s and this year’s production figures (water usage) and streamflows (water availability) at this time in the season (July 21).
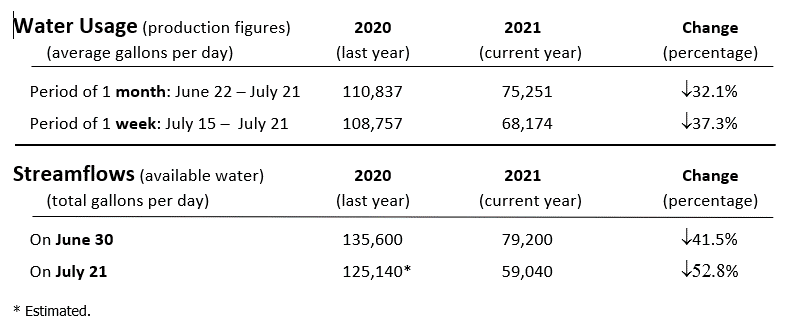
* Estimated.
Demand for water is down considerably from the same period last year -- by 37.3%. Moreover, demand during the past week (July 15-21) fell by 9.4% from the average demand for the full month ending on July 21, which is trending in the desired direction.
However, that 37.3% reduction in demand is not keeping pace with the year-over-year reduction in the streamflows (water availability), which are down from the same period in 2020 by an even greater percentage – 52.8%. Also, the streamflows are dropping considerably from day to day this year, from 79,200 gallons per day on June 30 to 59,040 gallons per day just three weeks later on July 21, which was an average drop of almost 1,000 gallons per day. This is particularly worrisome because there were a number of days of heavy overcast and morning fog drip early in the month of July, and it is unlikely that we will see very many such days again this summer – which we assume means the daily reduction in streamflows is accelerating.
Most ominous at this moment is that current average daily demand is exceeding streamflow availability by about 9,000 gallons per day. Once we can no longer make up this difference by drawing down tank storage levels, we will be forced to take severe measures (outdoor usage restrictions, mandatory rationing) to prevent drying up the streams.